Dashboard
Each Supervisor instance provides a Web Server and the Supvisors extension provides its own Web User Interface, as a replacement of the Supervisor one but using the same infrastructure.
Note
The information displayed in the Web User Interface is a synthesis of the information provided by all Supvisors instances and as perceived by the Supvisors instance that displays the web pages.
Important
About the browser compliance.
The CSS of the web pages has been written for Firefox ESR 91.3.0. The compatibility with other browsers or other versions of Firefox is unknown.
All pages are divided into 3 parts:
the Common Menu on the left side ;
a header on the top right ;
the content itself on the lower right.
Common Menu
Supvisors

Common Menu
Clicking on the ‘Supvisors’ title brings the Main page back.
The version of Supvisors is displayed underneath.
Supervisors
Below the Supvisors logo is the Supervisors part that lists all the Supvisors instances defined in the rpcinterface extension point
of the Supervisor configuration file.
The color gives the state of the Supvisors instance:
yellow for
STOPPED;grey-to-green gradient for
CHECKING;green for
CHECKEDandRUNNING;orange for
FAILED;red for
ISOLATED.
The Supvisors instance is blinking when it is handling starting or stopping jobs.
An additional red light is displayed in the event where a process is in a crash state (FATAL or unexpectedly
EXITED).
Only the hyperlinks of the CHECKED and RUNNING Supvisors instances are active.
The browser is redirected to the Supervisor page of the targeted Supvisors instance.
The Supvisors instance playing the role of Master is pointed out with the ✪ symbol.
Applications
Below is the Applications part that lists all the Managed applications defined through the group sections of the Supervisor configuration file and also declared in the Supvisors Supvisors Rules File. The color gives the state of the Application, as seen by the Supvisors instance that is displaying this page:
yellow for
STOPPED;yellow-to-green gradient for
STARTING;green-to-yellow gradient for
STOPPING;green for
RUNNING.
The application is blinking when it is part of the starting or stopping jobs managed by the local Supvisors instance.
An additional red light is displayed in the event where a failure has been raised on the application.
All hyperlinks are active. The browser is redirected to the corresponding Application page on the local Web Server.
Copyright
The bottom part of the menu contains a contact link to the Supvisors owner and maintainer and a copyright information.
Main Page
The Main Page shows a synoptic of the Supvisors status.

Supvisors Main page
Main Page Header
A first card on the left of the header may be displayed with the user software name and icon, if those are set in the Supvisors section of the Supervisor configuration file.
The next card provides the Supvisors state and is displayed at the center of the header:
OFF
This is the Supvisors starting phase. It is very transient and corresponds to the phase between the moment when Supervisor is started and the moment when it sends the running event to its listeners.
SYNCHRONIZATION
In this state, Supvisors waits for all Supvisors instances to connect themselves. Refer to the Synchronizing Supvisors instances section for more details.
In this state, the Supvisors XML-RPC API is restricted so that only version, master and Supvisors instance information are available.
ELECTION
In this state, Supvisors is electing a Master instance among the active Supvisors instances.
Like the previous state, the Supvisors XML-RPC API is restricted.
DISTRIBUTION
In this state, Supvisors is automatically starting applications. Refer to the Starting strategy section for more details.
The whole Status part and the Supvisors Control part of the Supvisors XML-RPC API are available from this state.
OPERATION
In this state, Supvisors is mainly:
listening to Supervisor events ;
publishing the events on its Event interface ;
checking the activity of all remote Supvisors instances ;
detecting eventual multiple running instances of the same program ;
providing statistics to its Dashboard.
The whole Supvisors XML-RPC API is available in this state.
CONCILIATION
This state is reached when Supvisors has detected multiple running instances of the same program. Supvisors is either solving conflicts itself or waiting for the user to do it. Refer to the Conciliation section for more details.
When conflicts are detected, the state button is blinking and clicking on it displays the Conciliation page.
The Supvisors XML-RPC API is restricted in this state. It is possible to stop applications and processes but the start requests are rejected.
Note
It may happen that Supvisors is temporarily in CONCILIATION state without any remaining conflict.
There is indeed a short moment (less than 5 seconds) between the last conflict conciliation and the Supvisors
state transition.
RESTARTING
Supvisors is stopping all processes before commanding its own restart, i.e. the restart of all Supvisors instances including a restart of their related Supervisor. Refer to the Stopping strategy section for more details.
The Supvisors XML-RPC API is NOT available in this state.
SHUTTING_DOWN
Supvisors is stopping all processes before commanding its own shutdown, i.e. the shutdown of all Supvisors instances including a restart of their related Supervisor. Refer to the Stopping strategy section for more details.
The Supvisors XML-RPC API is NOT available in this state.
FINAL
This is the final state of Supvisors, in which it remains inactive and waits for the Supervisor stopping event. This state is very transient too.
The Supvisors XML-RPC API is NOT available in this state.
The Supvisors modes are displayed alongside the state if activated:
starting
This mode is visible and blinking when the
Starterof any of the Supvisors instances has jobs in progress.
stopping
This mode is visible and blinking when the
Stopperof any of the Supvisors instances has jobs in progress.
On the right side, 5 buttons are available:
ends the Supvisors synchronization phase (only when Supvisors is in
SYNCHRONIZATIONstate andUSERis set in thesynchro_optionsoption) ;
restarts Supvisors through all Supvisors instances ;
shuts down Supvisors through all Supvisors instances ;
refreshes the current page ;
refreshes the current page and sets a periodic 5s refresh to the page.
Main Page Contents
For every Supvisors instance, a card is displayed in the contents of the Supvisors Main Page. Each box contains:
(on condition) a
star button allowing the user to ends the Supvisors synchronization phase and forcing the corresponding Supvisors instance as Master (only when Supvisors is in
SYNCHRONIZATIONstate andUSERis set in thesynchro_optionsoption);the Supvisors instance nick name, as a hyperlink to the same page, but provided by the targeted Supvisors instance, if the Supvisors instance is in the
CHECKEDor theRUNNINGstate ;the Supvisors instance state, colored with the same rules used in the Common Menu ;
the Supvisors instance process loading ;
the list of all processes that are running in this Supvisors instance, whatever they belong to a Managed application or not.
Hint
Clicking on a Supvisors instance displays the corresponding Processes Section.
Clicking on an application displays the corresponding Application Page.
Clicking on a process displays the corresponding Processes Section, with its statistics selected.

Supvisors Main page with USER sync
Conciliation Page
If the page is refreshed when Supvisors is in CONCILIATION state, a red light is blinking next to the ‘Supvisors’
title in the top left of the Common Menu.
This situation is unlikely to happen if the conciliation_strategy chosen in the rpcinterface extension point
of the Supervisor configuration file is different from USER, as the other values will trigger an immediate and
automatic conciliation of the conflicts.
The Conciliation Page can be reached by clicking on the ‘Supvisors’ title when the red blinking light is displayed.

Supvisors Conciliation page
Conciliation Page Header
The header of the Conciliation Page has exactly the same contents as the header of the Main page.
Conciliation Page Contents
On the left side of the page, the list of process conflicts is displayed into a table. A process conflict is raised when the same program is running in multiple Supvisors instances.
So the table lists, for each conflict:
the name of the program incriminated ;
the list of Supvisors instances where it is running ;
the uptime of the corresponding process in each Supvisors instance ;
for each process, a list of actions helping to the solving of this conflict:
Stop the process ;
Keep this process (and stop all others) ;
for each process, a list of automatic strategies (refer to Conciliation) helping to the solving of this conflict.
The right side of the page contains a simple box that enables the user to perform a global conciliation on all conflicts, using one of the automatic strategies proposed by Supvisors.
Supervisor Page
The Supervisor Page of Supvisors is the page that most closely resembles the legacy Supervisor page, hence its name, although it is a bit less “sparse” than the web page provided by Supervisor.
It shows the status of the Supvisors instance, as seen by the Supvisors instance itself as this page is always re-directed accordingly. It also enables the user to command the processes declared in this Supvisors instance and provides statistics that may be useful at software integration time.
Attention
All the actions available from this page involve only the Supervisor XML-RPC API (with the exception of statistics-related actions).
!!! The Supvisors rules do NOT apply here !!!
!!! Supvisors does NOT interfere with Supervisor in the execution of these actions !!!
As a consequence, it is possible to create process conflicts from this page, leading Supvisors to enter
the CONCILIATION state.
Supervisor Page Header
A first card on the left of the header may be displayed with the user software name and icon, if those are set in the Supvisors section of the Supervisor configuration file.
The status of the Supvisors instance is then displayed:
the Supvisors instance deduced name, marked with the ✪ sign if it is the Master ;
the current loading of the processes running in this Supvisors instance ;
the Supvisors instance state and modes (discovery, starting, stopping).
Note
The discovery mode is displayed when the Supvisors multicast interface is activated.
Note
The Supvisors instance modes are visible and blinking when the Starter or the Stopper of the considered
Supvisors instance has jobs in progress.
It doesn’t mean that a process is starting or stopping in the local Supervisor.
It means that the Supvisors instance is managing a start or a stop sequence, which could lead to processes being
started or stopped on any other Supervisor instance managed by Supvisors.
The ‘Statistics View’ card enables the user to choose the information presented on this page. By default, the Processes Section is displayed. The other choice is the Host Section. The Host button is named after the name of the node hosting the Supvisors instance. The periods can be updated in the rpcinterface extension point of the Supervisor configuration file.
Next to it, the ‘Statistics Period’ box enables the user to choose the period used for the statistics of this page. The periods can be updated in the rpcinterface extension point of the Supervisor configuration file.
Note
These two boxes are not displayed if the optional module psutil is not installed or if the statistics
are disabled through the stats_enabled option of the rpcinterface extension point of the Supervisor
configuration file.
On the right side, 5 buttons are available:
stops all the processes handled by Supervisor in the Supvisors instance using a
supervisor.stopAllProcessesXML-RPC ;
supervisor.restartXML-RPC ;
supervisor.shutdownXML-RPC ;
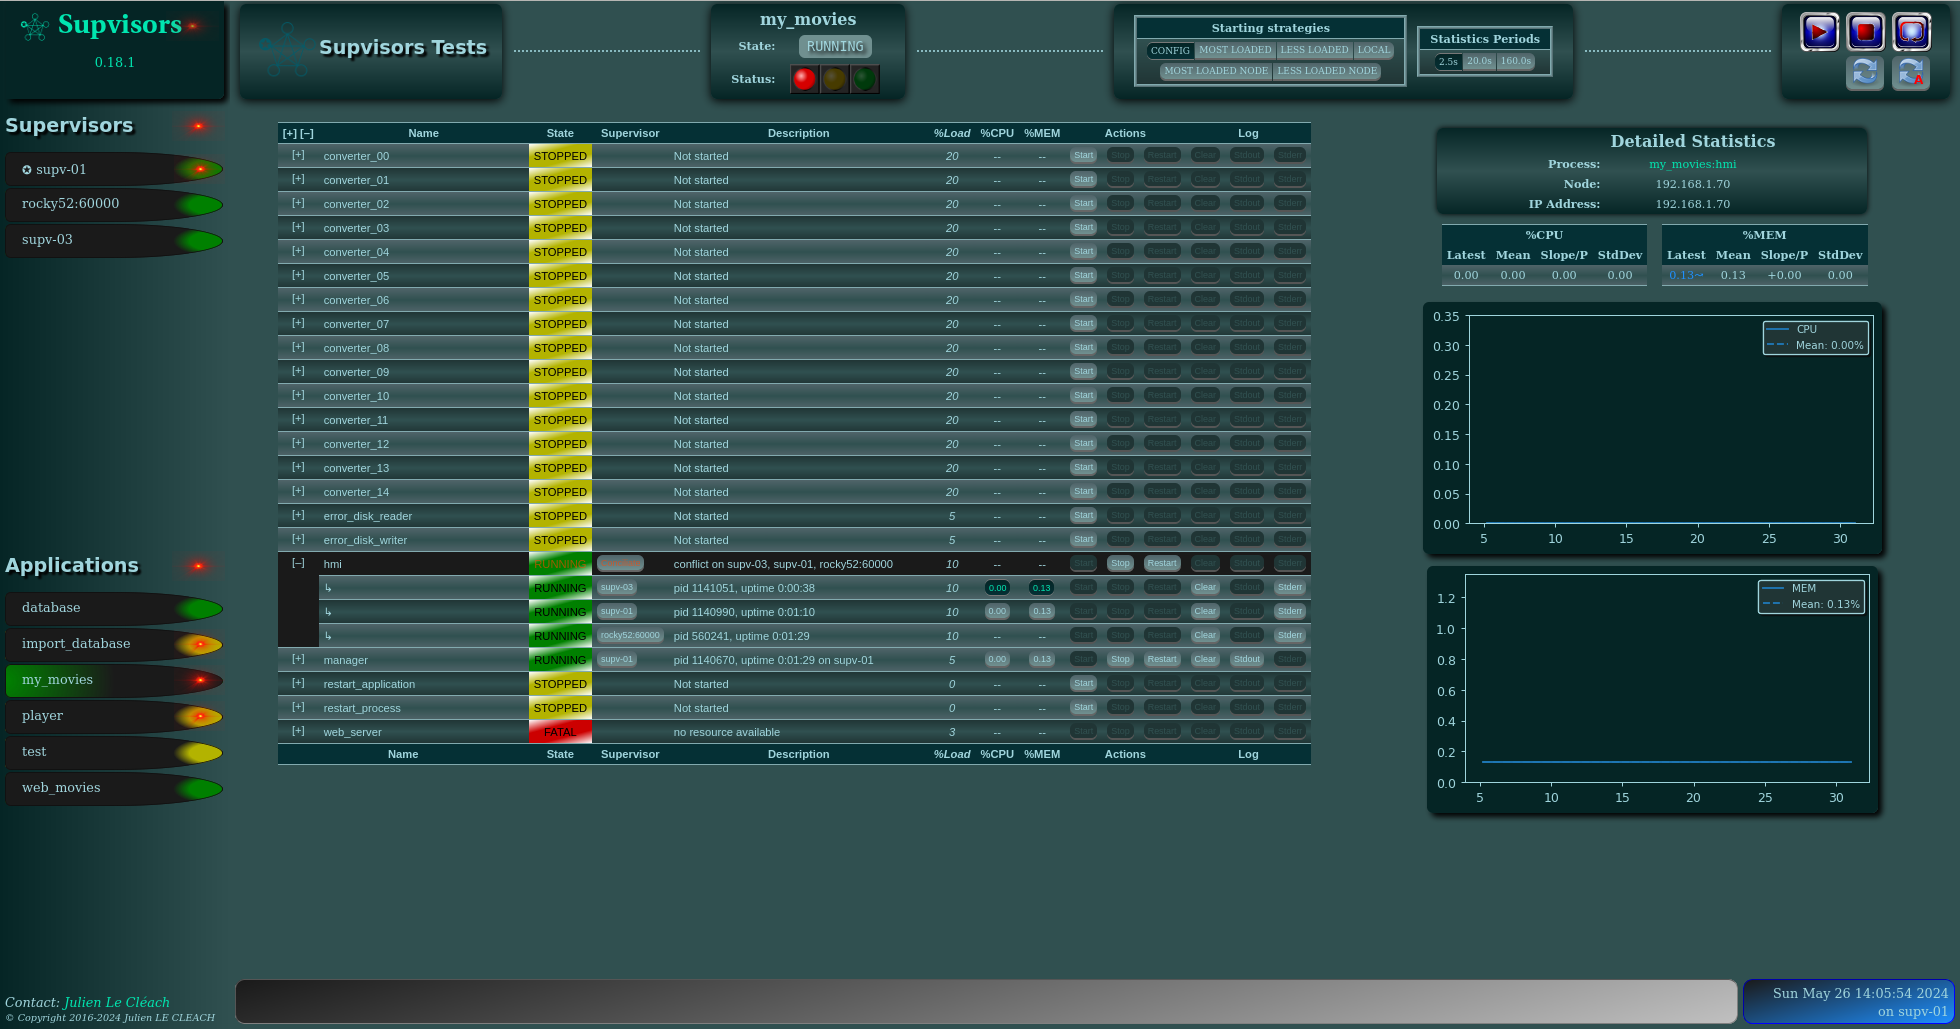
Processes Section

Supvisors Processes page
The Processes Section looks like the page provided by Supervisor. Indeed, it lists the programs that are configured in Supervisor, it presents their current state with an associated description and enables the user to perform some actions on them:
Log tail (with a refresh button, click on the process name itself) ;
Start (using a
supervisor.startProcess(namespec)XML-RPC);Stop (using a
supervisor.stopProcess(namespec)XML-RPC);Restart (using a multicall chaining
supervisor.stopProcess(namespec), thensupervisor.startProcess(namespec)XML-RPCs);Clear log ;
Tail stdout log (auto-refreshed) ;
Tail stderr log (auto-refreshed).
The activation of the Start, Stop and Restart buttons is depending on the process state. In addition to that, a stopped process cannot be started if the the corresponding program has been disabled.
The activation of the Clear, Stdout and Stderr buttons is depending on the configuration of the stdout_logfile
and stderr_logfile options of the Supervisor program configuration.
Supvisors shows additional information for each process, such as:
the loading declared for the process in the rules file ;
the CPU usage of the process during the last period (only if the process is
RUNNING) ;the instant memory (Resident Set Size) occupation of the process at the last period tick (only if the process is
RUNNING).
Note
CPU usage and memory are available only if the optional module psutil is installed and if the statistics
are not disabled through the stats_enabled option of the rpcinterface extension point of the Supervisor
configuration file.
Important
Supvisors collect the process statistics considering the process spawned by Supervisor and its children. In the event where the program command starts a process that is not attached to the command itself (e.g. a Docker container), the process statistics will NOT take into account this process and its children.
Here is the color code used for process states:
grey if the process state is
UNKNOWNor if the process is disabled ;yellow if the process is
STOPPEDor expectedlyEXITED;yellow-green gradient if the process is
STARTINGorBACKOFF;green if the process is
RUNNING;green-yellow gradient if the process is
STOPPING;red if the process is
FATALor unexpectedlyEXITED.
Note
For RUNNING processes, the color code used is a bit different if the process has ever crashed since Supvisors
has been started. The aim is to inform that process logs should be consulted.
‘standard’ |
|
|---|---|
|
|


All processes are grouped by their application name and Supvisors provides expand / shrink actions per application
to enable the user to show / hide blocks of processes.
Global expand / shrink actions are provided too in the top left cell of the table.
Considering the application processes that are running in this Supvisors instance, the application line displays:
the sum of their expected loading ;
the sum of their CPU usage ;
the sum of their instant memory occupation.
The following actions are also provided and apply to all application processes:
Start (using a
supervisor.startProcess('group:*')XML-RPC) ;Stop (using a
supervisor.stopProcess('group:*')XML-RPC);Restart (using a multicall chaining
supervisor.stopProcess('group:*'), thensupervisor.startProcess('group:*')XML-RPCs).
A click on the CPU or RAM measures shows detailed statistics about the process. This is not active on the application values. More particularly, Supvisors displays on the right side of the page a table showing for both CPU and Memory:
the last measure ;
the mean value ;
the value of the linear regression slope (unit is percent per period) ;
the value of the standard deviation.
A color and a sign are associated to the last value, so that:
green and ↗ point out an increase of the value since the last measure ;
red and ↘ point out a decrease of the value since the last measure ;
blue and ↝ point out the stability of the value since the last measure.
Underneath, Supvisors shows two graphs (CPU and Memory) built from the series of measures taken from the selected process:
the history of the values with a plain line ;
the mean value with a dashed line and value in the top right corner ;
the linear regression with a straight dotted line ;
the standard deviation with a colored area around the mean value.
Host Section

Supvisors Host page
The Host Section contains CPU, Memory, Network and Disk statistics for the considered node.
The CPU card shows statistics about the CPU on each core of the processor and about the average CPU of the processor.
The Memory card shows statistics about the amount of used (and not available) memory.
The Network card shows statistics about the receive and sent flows on each network interface.
The Disk card shows 2 different kinds of statistics:
Disk usage: the occupation percentage on every physical partition ;
Disk I/O: the read and written flows on every physical device.
Clicking on a button associated to the resource displays detailed statistics (graph and table), similarly to the process buttons.
Application Page
The Application Page of Supvisors:
shows the status of the managed application, as seen by the considered Supvisors instance ;
enables the user to command the application and its processes ;
provides statistics that may be useful at software integration time.

Supvisors Application page
Application Page Header
As per the other pages, a first card on the left of the header may be displayed with the user software name and icon.
The status of the Application is displayed on the left side of the header, including:
the name of the application ;
the state of the application ;
a led corresponding to the operational status of the application:
empty if not
RUNNING;red if
RUNNINGand at least one major failure is detected ;orange if
RUNNINGand at least one minor failure is detected, and no major failure ;green if
RUNNINGand no failure is detected.
The Application operational status is evaluated against the status_formula or the required options eventually
provided in the rules file.
The next part of the header is the ‘Starting strategy’ box that enables the user to choose the strategy to start the application programs listed below.
Strategies are detailed in Starting strategy.
Then follows the ‘Statistics Period’ box that enables the user to choose the period used for the statistics of this page. The periods can be updated in the rpcinterface extension point of the Supervisor configuration file.
On the right side, 4 buttons are available:
Application Page Contents
The table lists all the programs belonging to the application, and it shows:
the ‘synthetic’ state of the process (refer to this note for details about the synthesis) ;
the Supvisors instance where it runs, if appropriate, and a click on the button redirects to the corresponding Supervisor page ;
the description (after initialization from Supervisor, the nick name of the corresponding Supvisors instance is added depending on the state) ;
the loading declared for the process in the rules file ;
the CPU usage of the process during the last period (only if the process is
RUNNING) ;the instant memory (Resident Set Size) occupation of the process at the last period tick (only if the process is
RUNNING).
Like the Supervisor page, the Application page enables the user to perform some actions on programs:
Start ;
Stop ;
Restart ;
Clear log ;
Tail stdout log (auto-refreshed) ;
Tail stderr log (auto-refreshed).
The difference is that the process is not started necessarily in the Supvisors instance that displays this page. Indeed, Supvisors uses the rules of the program (as defined in the rules file) and the starting strategy selected in the header part to choose a relevant Supvisors instance. If no rule is defined for the program, the Start button will be disabled.
As previously, a click on the CPU or Memory measures shows detailed statistics about the process. And unlike the Supervisor page, statistics information are not hidden in this page because they may have been collected on the other nodes (due to a different configuration) and thus can be made available here.
Supvisors provides expand / shrink actions per process to enable the user to show / hide the process status
on all Supvisors instances where it is configured.
Global expand / shrink actions are provided too in the top left cell of the table.
Note
The Start, Stop and Restart actions are not allowed on the expanded rows. Only the Stop button may be considered in a later version.
In the event of a process conflict where the process is running on multiple Supvisors instances, the following applies:
the ‘synthetic’ state of the process - expected RUNNING - is blinking ;
the instance button is replaced by a Conciliate blinking button, redirecting to the Conciliation page ;
the description lists all Supvisors instances where the process is running ;
no process statistics are made available on the ‘synthetic’ row, but are still available on the detailed rows ;
the log buttons are disabled, again still available on the detailed rows if applicable.
Supvisors Application page with conflicts